리뷰 페이지 구성중 아래의 이미지처럼 리뷰 점수의 비율에 따른 막대그래프 구현이 필요했다.
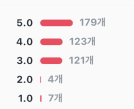
편하게 구현할 수 있는 쓸만한 패키지를 발견해서 글을 써보도록 한다.
vertical_barchart | Flutter Package
Simple, responsive and beautiful Vertical BarChart.
pub.dev
각각의 막대그래프의 정보를 기입한다. jumlah는 해당 막대그래프의 데이터 수이다. 총개수에서 자동으로 백분율로 변환하여 그래프로 나타내어 준다.
List<VBarChartModel> bardata = [
      VBarChartModel(
        index: 0,
        label: "5.0",
        colors: [Color(0xfff93f5b), Color(0xfff93f5b)],
        jumlah: 179.w,
        tooltip: "179개",
      ),
      VBarChartModel(
        index: 1,
        label: "4.0",
        colors: [Color(0xfff93f5b), Color(0xfff93f5b)],
        jumlah: 123.w,
        tooltip: "123개",
      ),
      VBarChartModel(
        index: 2,
        label: "3.0",
        colors: [Color(0xfff93f5b), Color(0xfff93f5b)],
        jumlah: 121.w,
        tooltip: "121개",
      ),
      VBarChartModel(
        index: 3,
        label: "2.0",
        colors: [Color(0xfff93f5b), Color(0xfff93f5b)],
        jumlah: 4.w,
        tooltip: "4개",
      ),
      VBarChartModel(
        index: 4,
        label: "1.0",
        colors: [Color(0xfff93f5b), Color(0xfff93f5b)],
        jumlah: 7.w,
        tooltip: "7개",
      ),
    ];
그래프의 색깔, 설명, 제목, 총 개수 등 그래프의 설정값을 기입하는 부분이다.
  Widget _buildGrafik(List<VBarChartModel> bardata) {
    return VerticalBarchart(
      background: Colors.transparent,
      labelColor: Color(0xff283137),
      tooltipColor: Color(0xff8e97a0),
      maxX: 400,
      data: bardata,
      barStyle: BarStyle.DEFAULT,
    );
  }
아래는 풀 코드이다
import 'package:flutter/material.dart';
import 'package:flutter_screenutil/flutter_screenutil.dart';
import 'package:flutter_svg/flutter_svg.dart';
import 'package:vertical_barchart/vertical-barchart.dart';
import 'package:vertical_barchart/vertical-barchartmodel.dart';

class ProductReview extends StatelessWidget {
  const ProductReview({Key? key}) : super(key: key);

  @override
  Widget build(BuildContext context) {
    List<VBarChartModel> bardata = [
      VBarChartModel(
        index: 0,
        label: "5.0",
        colors: [Color(0xfff93f5b), Color(0xfff93f5b)],
        jumlah: 179.w,
        tooltip: "179개",
      ),
      VBarChartModel(
        index: 1,
        label: "4.0",
        colors: [Color(0xfff93f5b), Color(0xfff93f5b)],
        jumlah: 123.w,
        tooltip: "123개",
      ),
      VBarChartModel(
        index: 2,
        label: "3.0",
        colors: [Color(0xfff93f5b), Color(0xfff93f5b)],
        jumlah: 121.w,
        tooltip: "121개",
      ),
      VBarChartModel(
        index: 3,
        label: "2.0",
        colors: [Color(0xfff93f5b), Color(0xfff93f5b)],
        jumlah: 4.w,
        tooltip: "4개",
      ),
      VBarChartModel(
        index: 4,
        label: "1.0",
        colors: [Color(0xfff93f5b), Color(0xfff93f5b)],
        jumlah: 7.w,
        tooltip: "7개",
      ),
    ];
    return Scaffold(
      resizeToAvoidBottomInset: false,
      body: SingleChildScrollView(
        child: Padding(
          padding: EdgeInsets.fromLTRB(16.w, 20.h, 0, 0),
          child: Container(
            width: 180.w,
            height: 130.h,
            child: _buildGrafik(bardata),
          ),
        ),
      ),
    );
  }

  Widget _buildGrafik(List<VBarChartModel> bardata) {
    return VerticalBarchart(
      background: Colors.transparent,
      labelColor: Color(0xff283137),
      tooltipColor: Color(0xff8e97a0),
      maxX: 400,
      data: bardata,
      barStyle: BarStyle.DEFAULT,
    );
  }
}
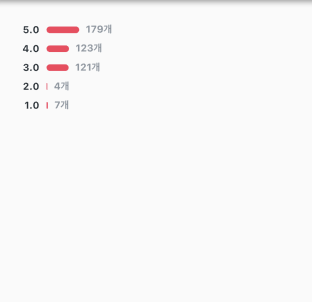
결과 화면
'ETC > Flutter' 카테고리의 다른 글
| [flutter] listView Scroller disable(리스트 뷰 스크롤 막기) (0) | 2021.12.06 |
|---|---|
| [flutter] 서버로 이미지 업로드 하기(Dio, image_picker) (0) | 2021.11.30 |
| [flutter] tabar&tabbar view 스와이프 제한하기 (0) | 2021.11.23 |
| [flutter] 이미지 추가 시 unable to load asset 에러 해결 방법 (0) | 2021.11.23 |
| [flutter] Bottom Overflowed By ??? Pixels 오류 해결 (0) | 2021.11.23 |
| [flutter] 도로명 주소 검색하기 kpostal Pacakge (1) | 2021.11.20 |


댓글